REIT Benchmark ETFs Find Support As Regional Bank Stocks Dive
Author: John Navin | March 15, 2023 09:04am
Real estate investment trusts (REITs) stopped heading lower Monday as indicated by the closing prices of the benchmark REIT exchange-traded funds (ETFs).
Despite concern for the sector following the collapse of Silicon Valley Bank and Signature Bank, the Real Estate Select Sector SPDR Fund (NYSE:XLRE) and iShares U.S. Real Estate ETF (NYSE:IYR) had up days.
This week’s release of the latest consumer price index (CPI) is the next market-moving piece of data, and REITs are highly likely to move up or down again based on the information. If the CPI shows higher inflation in February, the Federal Reserve may act to continue its policy of raising interest rates.
Has the rate-sensitive real estate investment trust group found an intermediate-term low, or will the inflation metrics cause further erosion of price? The picture will become clearer by week’s end, but in the meantime, here’s how it looks for the big REIT benchmark ETFs.
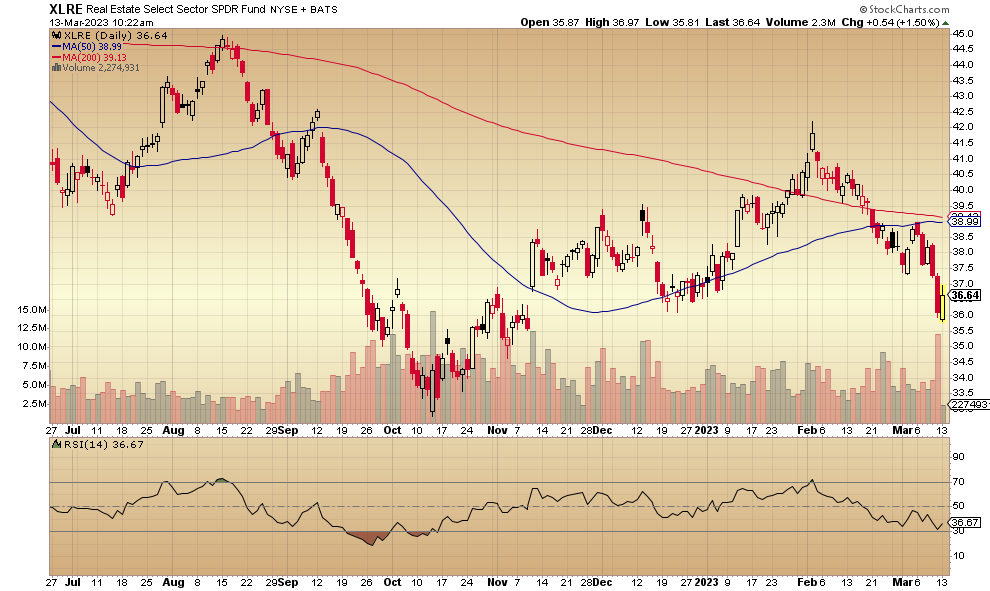
Here’s the daily chart for the Real Estate Select Sector SPDR Fund which holds 33 publicly traded REITs:

Buying came in and propelled the price from the $35.75 level to back above $37 before sellers returned late in the Monday session to close the REIT at $36.68. Note that the buying volume was very heavy — you can see it in the greyish bar just below the prices on the chart.
The monthly chart looks like this:
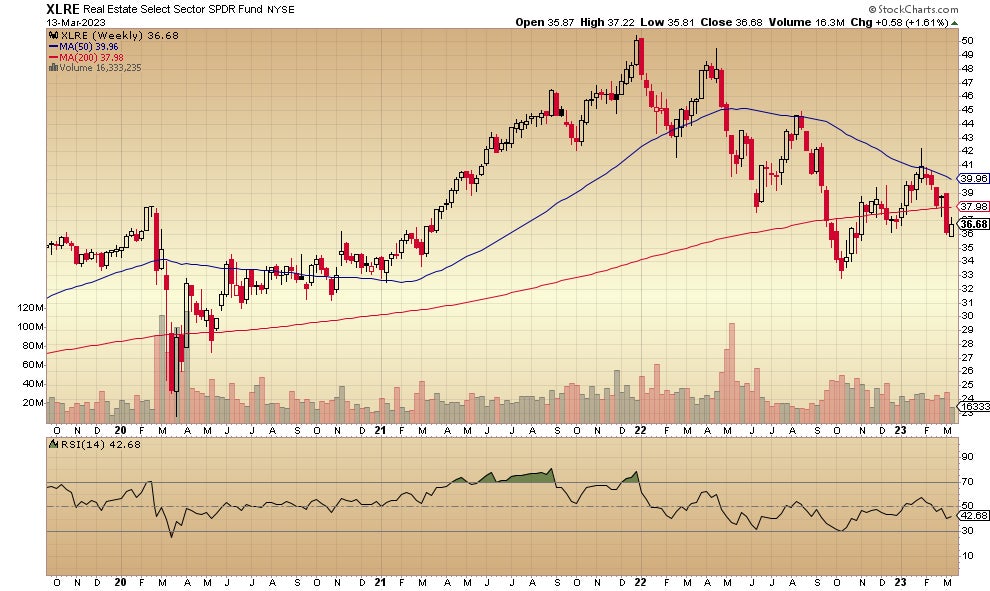
Below both the 50-week moving average (the blue line) and the 200-week moving average (the red line) is a bearish look. Investors will be studying price movement closely – a break above the $42 February peak would take this back to bullish.
Here’s the iShares U.S. Real Estate ETF daily chart:
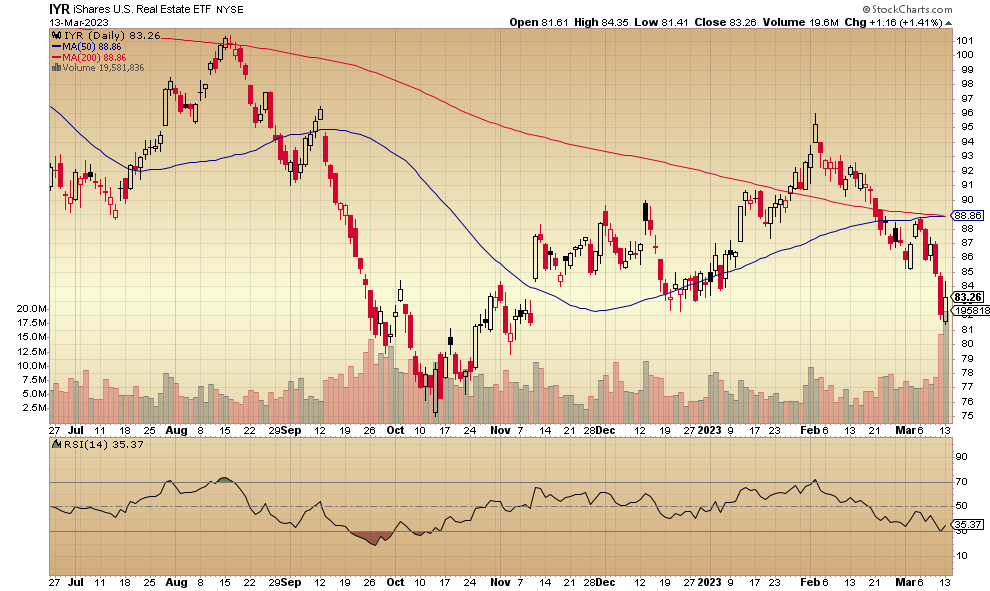
This fund, representing a broader range with 82 REITs, held the $82-$83 level with the same kind of heavy buying seen in the Real Estate Select Sector SPDR Fund.
Here’s the weekly chart:
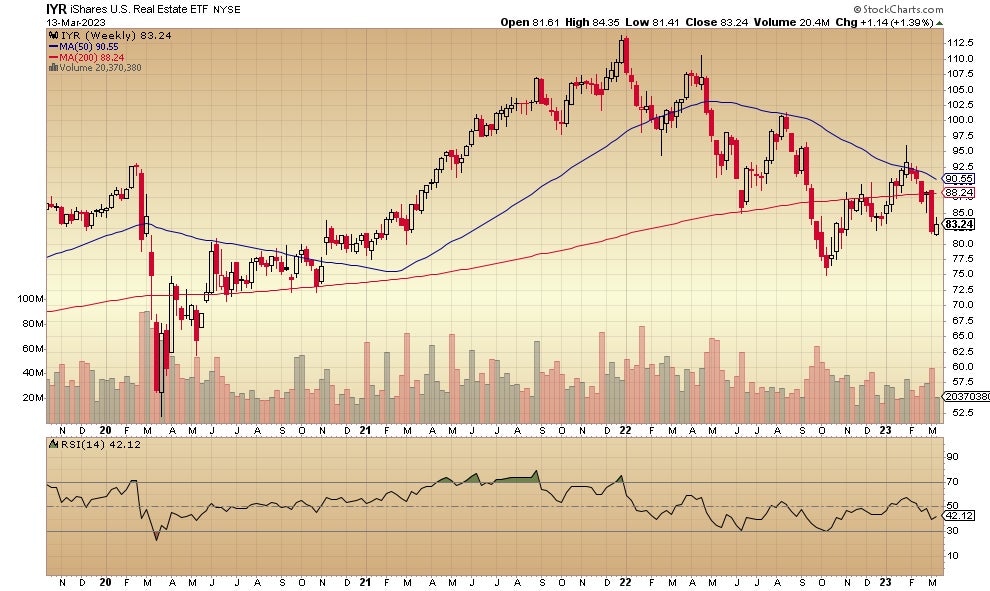
This REIT ETF is in a bearish kind of configuration with the price below both of the significant moving averages. It needs to break back above the February high of just over $95 to regain any kind of bullish look again.
Not investment advice. For educational purposes only.
Weekly REIT Report: REITs are one of the most misunderstood investment options, making it difficult for investors to spot incredible opportunities until it’s too late. Benzinga’s in-house real estate research team has been working hard to identify the greatest opportunities in today’s market, which you can gain access to for free by signing up for Benzinga’s Weekly REIT Report.
Over the past five years, private market real estate investments have outperformed the publicly traded REIT market by about 50%. Check out Benzinga’s Real Estate Offering Screener to discover the latest passive real estate investments.
Check Out More on Real Estate from Benzinga
Posted In: IYR XLRE