Looking To Invest In Natural Disaster Recovery? This Fund (FEMA) Holds 63 Stocks Focused On Assisting In The Inevitable
Author: Melanie Schaffer | February 03, 2023 03:54pm
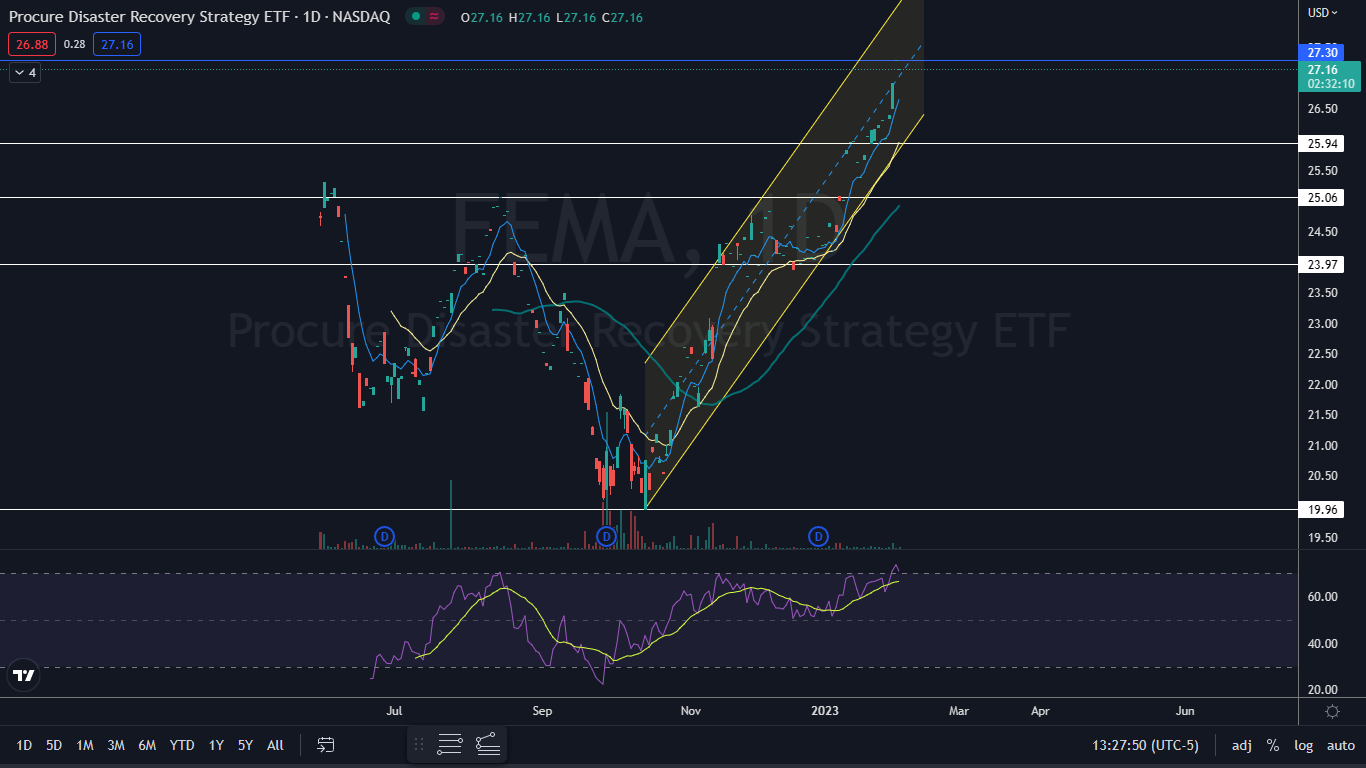
The Procure Disaster Recovery Strategy ETF (NASDAQ:FEMA) gapped down about 0.5% on Friday on lower-than-average volume after gapping up to reach an all-time high of $27.30 on Thursday.
Although the ETF currently lacks liquidity, FEMA outperformed the S&P 500 by almost 50% since Oct. 13, trading up 36% off the low on that day of $19.96. In comparison, the S&P 500 rose 19.6% over the same time frame.
Since FEMA’s inception on June 1, 2022, the ETF gained 8.9% compared to the S&P 500, which was down 0.5% since that date.
FEMA tracks 63 companies engaged in natural disaster recovery, specifically stocks focused on recovering from natural disasters, such as hurricanes, wildfires, floods or earthquakes.
“Having lived through multiple major natural disasters, the theme of natural disaster protection and recovery has remained prescient. As natural disasters continue to occur more frequently and with more devastating and costly results, it is concerning that so few people realize the importance of and opportunity for this major slice of the global economy,” Procure co-founder and CEO Andrew Chanin told Benzinga.
“The White House believes that Natural Disasters could cost the Federal Budget alone, ~$2Trillion/year by the end of the century and most individuals have not yet begun to position themselves for the potential of these critical industries,” Channin added.
FEMA’s largest holdings include Maxar Technologies Inc (NYSE:MAXR), weighted at 2.97%; Fujitsu, weighted at 2.13%; Generac Holdings Inc (NYSE:GNRC), weighted at 1.99% and Willdan Group, Inc. (NASDAQ:WLDN), with a 1.98% weighting.
The fund has a small float, with just 25,000 shares outstanding, which could cause the ETF to rise quickly when demand increases. FEMA’s net assets total $683,835.41.
Want direct analysis? Find me in the BZ Pro lounge! Click here for a free trial.
The FEMA Chart: FEMA has been trading in a strong and consistent uptrend since Oct. 13, making a series of higher highs and higher lows. The ETF’s most recent higher low was formed on Jan. 18 at $25.63 and the most recent higher high was printed at the all-time high on Thursday.
- On Friday, FEMA retraced on lower-than-average volume, which suggested consolidation. If buyers come in later on Friday or on Monday, the stock is likely to print another new all-time high.
- FEMA may be settling into a rising channel pattern on the daily chart, which is considered bullish unless a stock or ETF breaks down from the lower ascending trendline of the formation on higher-than-average volume. On Friday, FEMA was backtesting the median line of the channel and holding above the area, which is bullish.
- The ETF is trading above the eight-day and 21-day exponential moving averages (EMAs), with the eight-day EMA trending above the 21-day, both of which are bullish indicators. FEMA is also trading well above the 50-day simple moving average, which indicates the ETF is currently enjoying a bull cycle.
- FEMA has mild resistance above at the all-time high and mild support below at $25.94 and $25.06.
Read Next: Is This The End Of The Bear Market? S&P 500 Nears Key Metric, Golden Cross Set To Form
Photo: Triff via Shutterstock
Posted In: FEMA GNRC MAXR WLDN