Nasdaq Suffers Worst Start To December Since 1975: Will Santa Visit The Market Or Will The Grinch Hold Strong?
Author: Melanie Schaffer | December 08, 2022 03:11pm
The Nasdaq Composite Index was bouncing up almost 1% higher on Thursday, in relief, after suffering its worst first week of December since 1975, plunging 4.4% between the Nov. 30 closing price and the session finish on Wednesday.
With the stock market entering a bear cycle this year, most retail traders and investors have been hoping for an end-of-year rally to finish 2023 off on a higher note.
While the Nasdaq and the S&P 500 have been trading in very consistent monthly downtrends since November 2021 and January 2022, the S&P 500 temporarily crossed above the 200-day simple moving average on Nov. 30, bringing hope the bear market could end.
The S&P 500’s short three-day breach of the 200-day proved to be a bull trap, however, and the ETF has since declined back under the area, indicating the bears have not yet headed into hibernation.
The Nasdaq has shown weakness in comparison to the S&P 500 due to tech stocks taking the brunt of the selling pressure this year. For technical traders, the Nasdaq’s comparative weakness, led lower by Amazon.com, Inc. (NASDAQ:AMZN) and Tesla Inc (NASDAQ:TSLA) was a warning sign that the bulls were too weak to take back control.
Despite the weakness, a Santa Claus rally remains a possibility as the back half of December approaches and traders will be watching to see if the rally, if it happens, is strong enough to signal there’s enough bullish momentum to break the bear cycle.
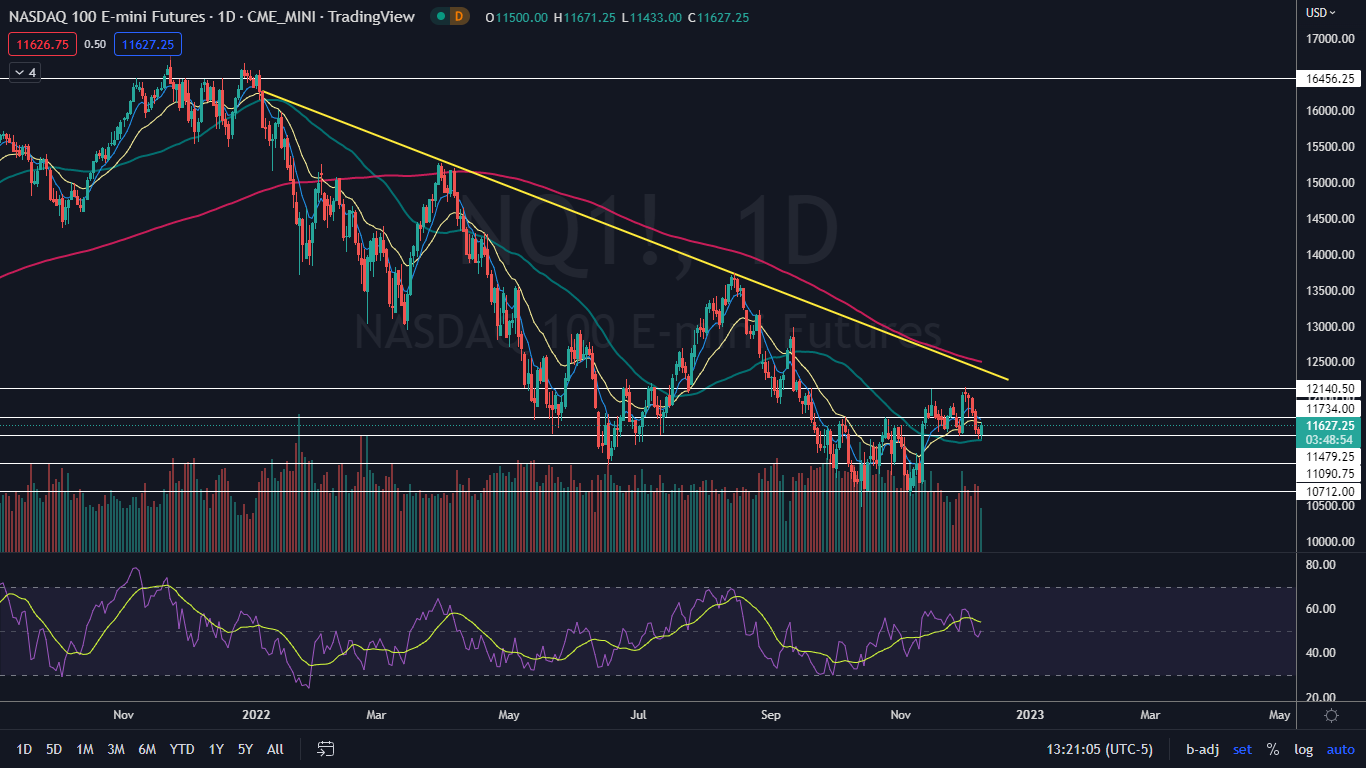
To judge this, technical traders will be watching Nasdaq 100 E-Mini Futures (NQ1) for signs of strength into the end of the year. Specifically, bullish traders want to see NQ1 continue to hold above the 50-day SMA, which could cause it to reverse course and rebound up into the 200-day.
Want direct analysis? Find me in the BZ Pro lounge! Click here for a free trial.
The NQ1 Chart: NQ1 dropped to tag the 50-day SMA on Wednesday and Thursday and has so far held support at the level. Bears want to see a larger bearish volume come in to force NQ1 under the 50-day, which could set the index into a steeper downtrend.
- Bullish traders want to see NQ1 hold above the 50-day, where it has so far printed a bullish double-bottom pattern near $11,400. If the pattern is recognized, it could signal a reversal to the upside, which could eventually negate the current downtrend on the daily chart.
- In the short-term, bullish traders want to see enough bullish volume come into NQ1 to prop it up over the eight-day exponential moving average (EMA). If NQ1 doesn’t regain the eight-day EMA over the next few days, a bear flag that appears to be developing could dominate the next few weeks.
- Bearish traders are happy to see that despite NQ1 and the S&P 500 trading significantly lower than this time last year, neither fund has its relative strength index measuring anywhere near oversold territory on the daily chart. This indicates that if NQ1’s bear flag is recognized, any bounce could be short-lived.
- Bullish traders are hoping a Santa rally, which is more likely to take place in bear markets, takes place. If that happens, all bearish signals on both the S&P 500 and NQ1’s charts could easily be negated.
- NQ1 has resistance above at $11,734 and $12,140 and support below at $11,479.25 and $11,090.75.
Read Next: Amazon Leads The Market Lower, Flashes Warning Sign The Bears Remain In Control: What's Next?
Photo: Roman Samborskyi via Shutterstock
Posted In: AMZN TSLA