7 Stocks Forming Bearish Chart Patterns In June
Author: bapitalgroup@gmail.com | June 14, 2022 11:26am
Several US stocks are forming bearish chart patterns in June. The bearish chart patterns forming are well-known chart patterns used in technical analysis including:
- Bear Flags
- Head & Shoulders
- Descending Triangles
- Rising Channel Break
- Bearish Pennant
These patterns can indicate further price declines if the price of the stocks mentioned can break down below critical support levels. Below are the seven stocks forming bearish chart patterns.
1. Crowdstrike Holdings

Crowdstrike Holdings (NASDAQ:CRWD) is a cybersecurity company that provides endpoint security, threat intelligence, and cyberattack response services to its customers. The price chart above shows a bear flag chart pattern forming.
A bear flag indicates that there may be further price declines if the stock price breaks down below the support level of the flag. Technical analysis style traders will be watching the support level of the bear flag for a potential signal of a continuation of the bearish trend.
The bear flag pattern forming on the price chart of Crowdstrike stock is considered invalid if the price moves above the flag pattern's upper resistance level.
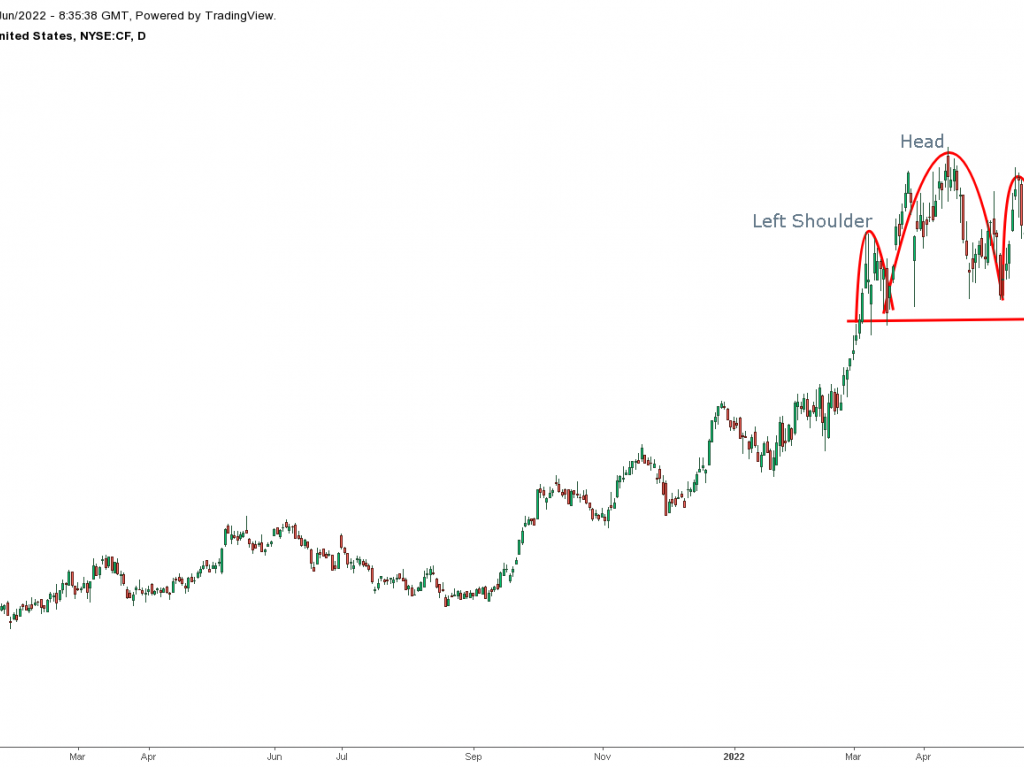
2. CF Industries Holdings
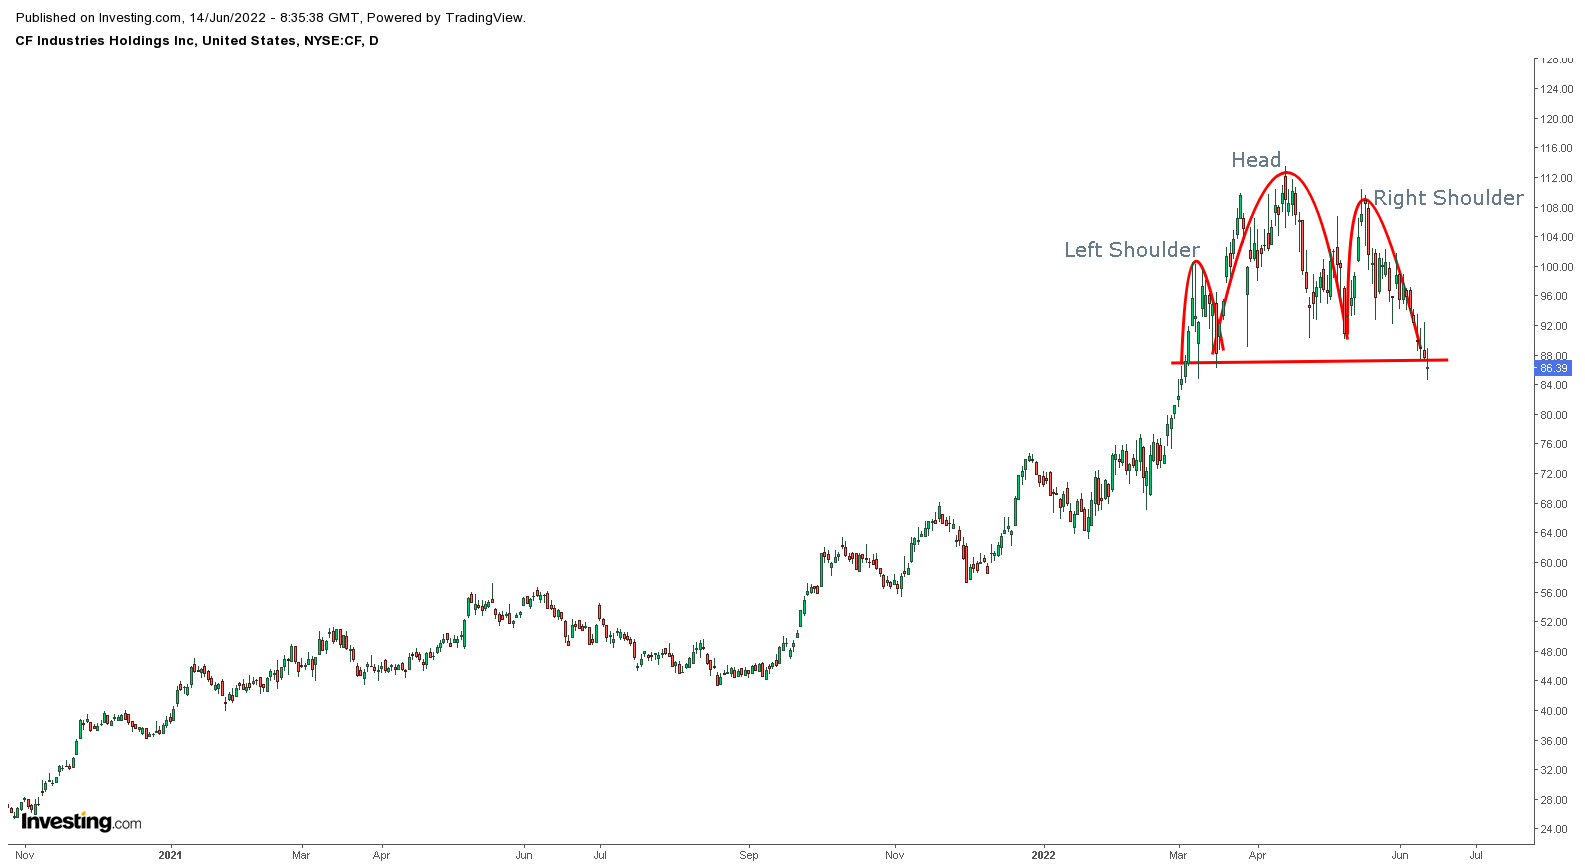
CF Industries Holdings (NYSE:CF) is a manufacturer and distributor of agriculture fertilizers. The price chart above shows a head and shoulders pattern forming. A head and shoulders pattern is a bearish price reversal chart pattern that indicates that the price of a market may reverse from a bullish trend to a bearish trend.
Traders will be watching the price around the support level of the head and shoulders pattern, also known as the "neckline," for a signal that the price may start to decline and move much lower over the coming weeks. If the price starts to increase and moves above the right shoulder price level, the head and shoulder pattern is deemed invalid, and the bearish pattern is no longer used.
3. Visa

Visa (NYSE:V) is a company that provides electronic fund transfers through Visa-branded credit cards, debit cards, and prepaid cards. From the price chart above, there is a descending triangle pattern forming. A descending triangle indicates that the market price may continue to move lower if the price can break below the support level of the pattern.
Traders will be watching to see if the price will move toward the support level and break below it for a signal that further price declines may be coming. If the price moves higher and above the downward sloping resistance level, the descending triangle pattern is deemed invalid and is no longer considered a bearish pattern.
4. MP Materials Corp
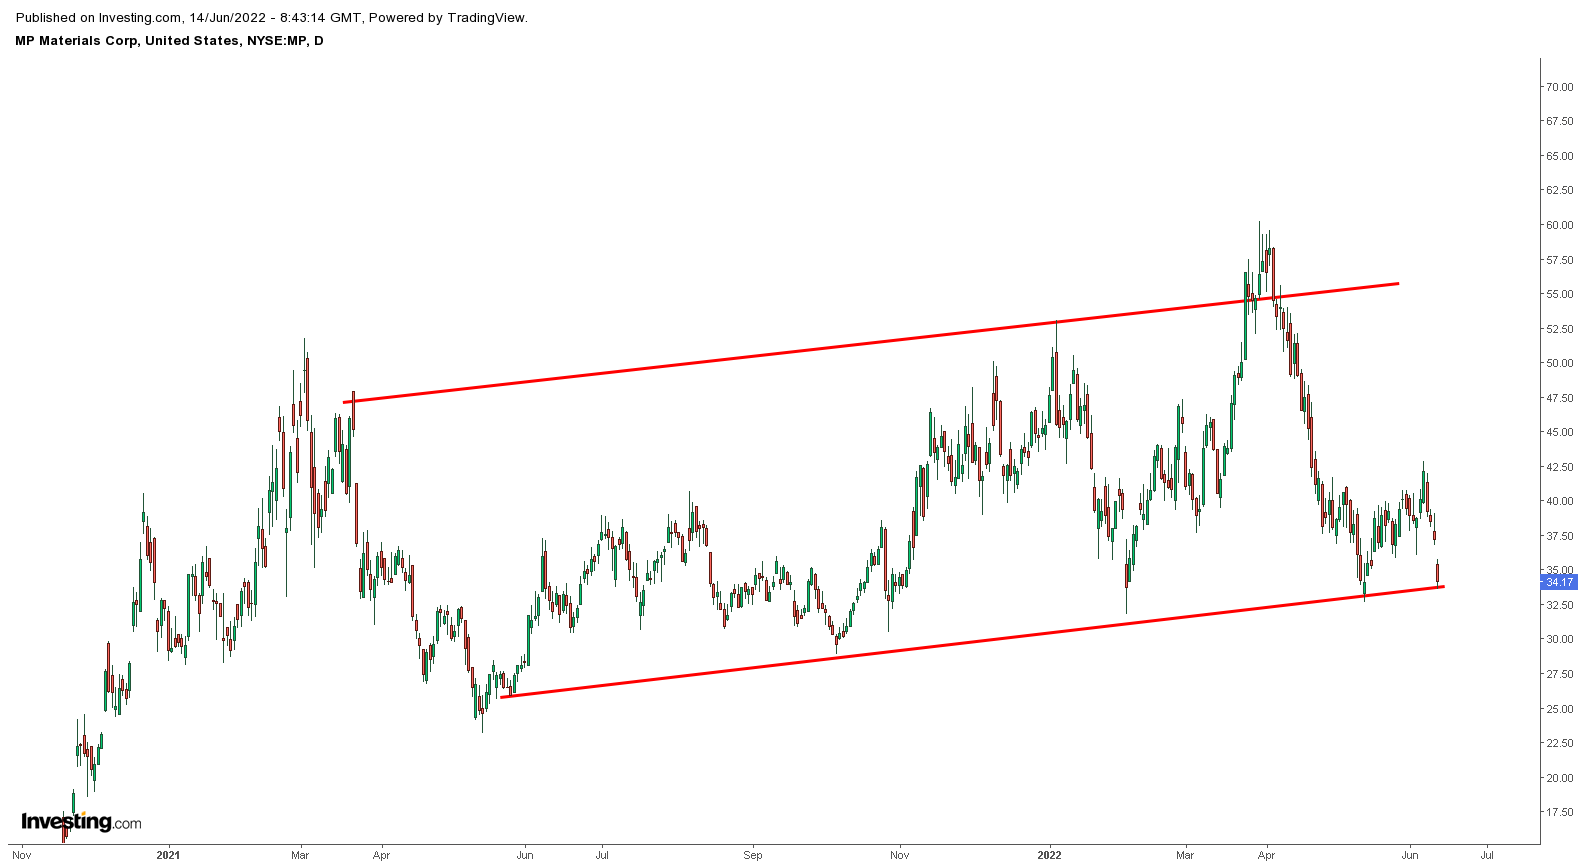
MP Materials (NYSE:MP) is a rare earth materials company that owns and operates the Mountain Pass mine. In the price chart, there is a rising channel pattern forming. A rising channel pattern can be bearish if the price of a market breaks down below the rising support level of the pattern.
Traders will watch the price action around the channel's support level. If the price breaks down below this level, it may signal a further decrease in the price of the stock over the coming weeks or months. If the price increases and moves above the channel's resistance level, the channel is deemed invalid, and the bearish pattern is no longer present.
5. Chewy
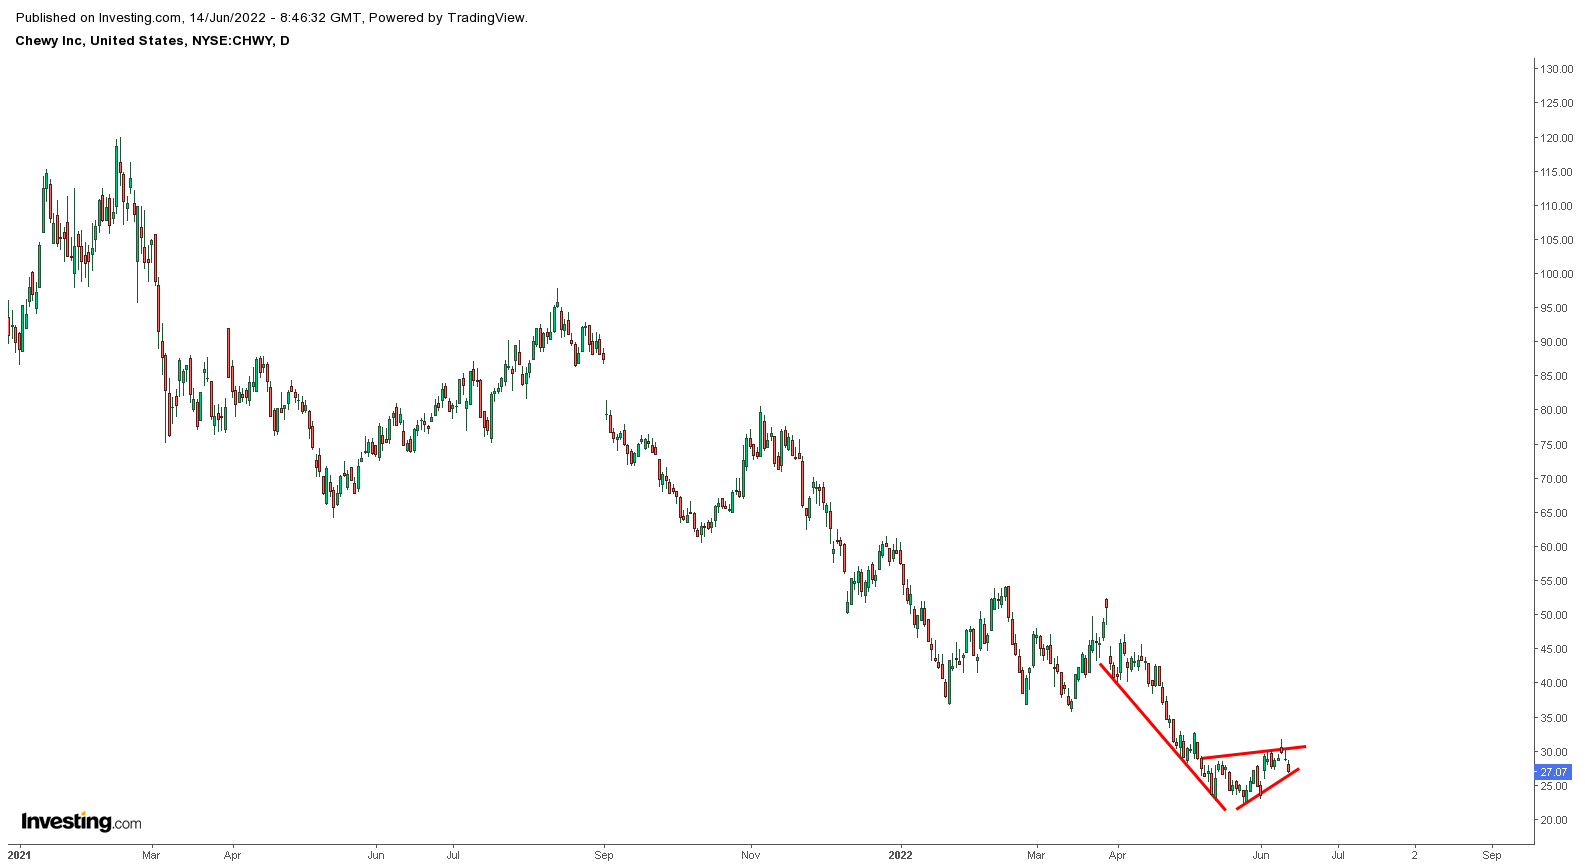
Chewy (NYSE:CHWY) is an online e-commerce retailer offering pet-related products to American consumers. From the price chart, there is a bearish pennant pattern forming. A bearish pennant pattern can be bearish if the price of a market moves below the rising support level of the pennant.
Traders will watch the price if it moves down below the support level of the pennant pattern. If the price can decline below this support level, this can potentially signal further declines in the stock price over the coming days and weeks.
If the price moves above the resistance level of the pennant pattern, the pennant is deemed invalid and no longer present on the price chart.
6. Hyatt Hotels
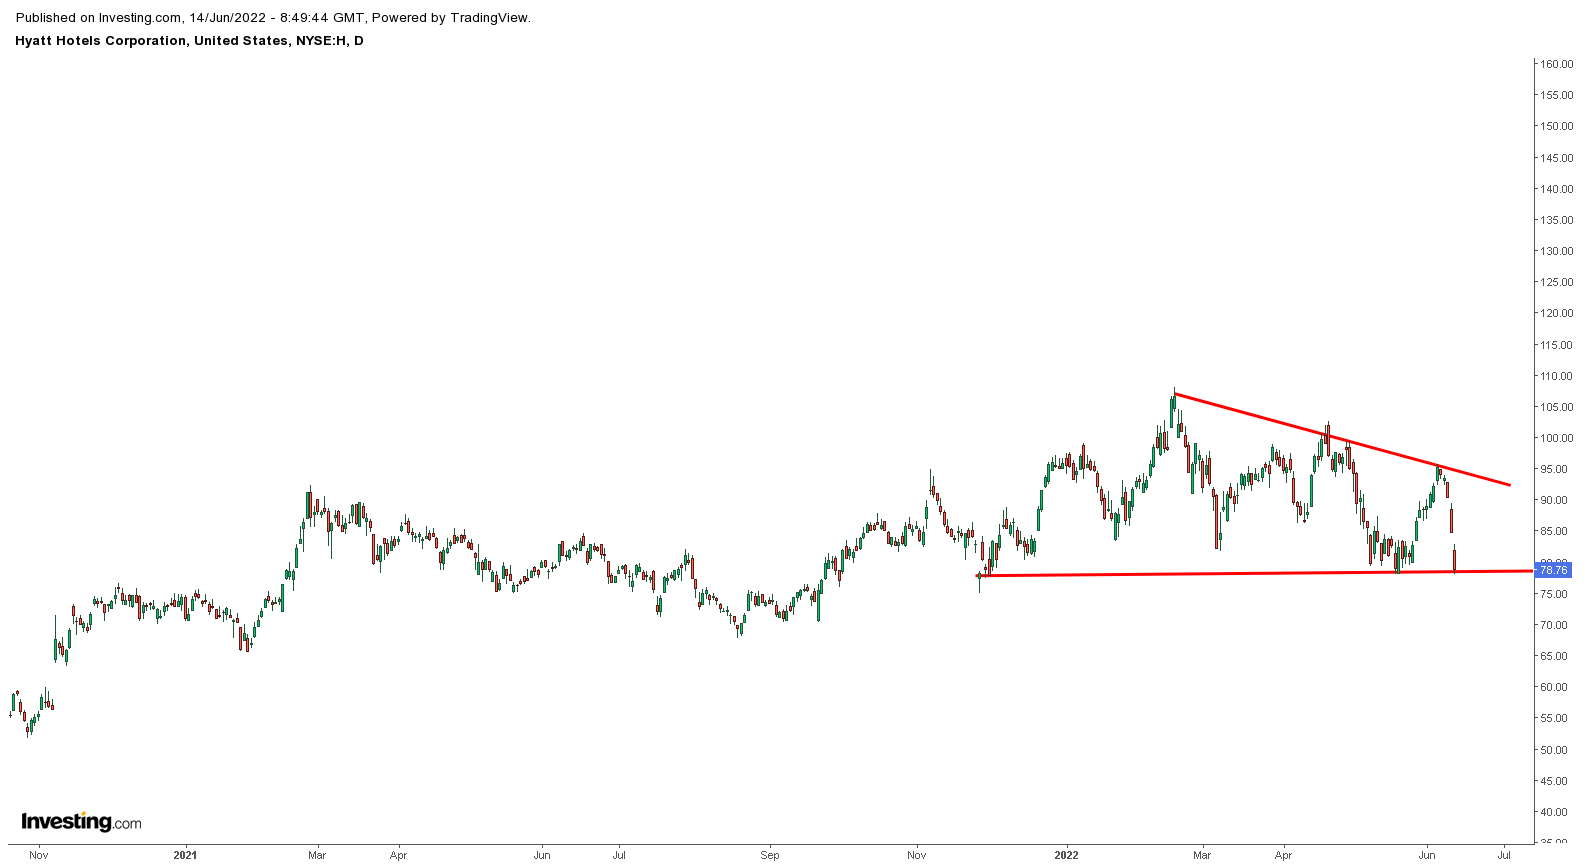
Hyatt Hotels (NYSE:H) is a hospitality company that owns, manages, operates, and franchises a chain of hotels and resorts around the world. The stock price chart of Hyatt Hotels above shows a bearish descending triangle pattern forming.
Traders will watch the stock's price if it reaches the support level of this descending triangle pattern. A breakdown in the price below the support level of the pattern can signal a bearish trend and further price declines over the coming days and weeks.
If the stock price of Hyatt Hotels rises above the descending triangle resistance level, it is deemed invalid, and the bearish pattern is no longer present.
7. Shopify

Shopify (NYSE:SHOP) is an e-commerce software platform that provides customers with all the tools and software required to set up their online stores. The stock price chart of Shopify above shows a bear flag pattern is forming. If the price of Shopify stock breaks down below the support level, it may indicate further price declines over the coming days and weeks.
The bear flag pattern is considered invalid if the price of Shopify stock increases above the resistance level of the pattern.
Conclusion
These seven stocks are showing signs of bearish price action in the market. However, if the prices of these stocks rise above the chart pattern resistance level, the bearish patterns are no longer valid. The recent steep declines in prices of the S&P500 Index, the NASDAQ and other major US indices have certainly weighed heavily on individual stocks.
Disclaimer: As always, traders and investors should do their due diligence on any stock they trade or invest in. The information provided is for educational purposes only and should not be considered investment advice in any market or stock.
Posted In: CF CHWY CRWD H MP SHOP V