Tilray Stock Is Getting Squeezed Between 2 Key Levels
Author: Tyler Bundy | May 07, 2021 04:06pm
Tilray Inc. (NASDAQ:TLRY) shares were trading higher Friday after a Jefferies analyst double upgraded the stock.
The stock was double upgraded from Underperform to Buy and the price target was raised from $4.77 to $23.
Tilray recently closed a merger with Aphria Inc. (NASDAQ:APHA).
Click here to read more about why Tilray is moving.
Tilray was up 14.7% at $16.23 ahead of the market close Friday.
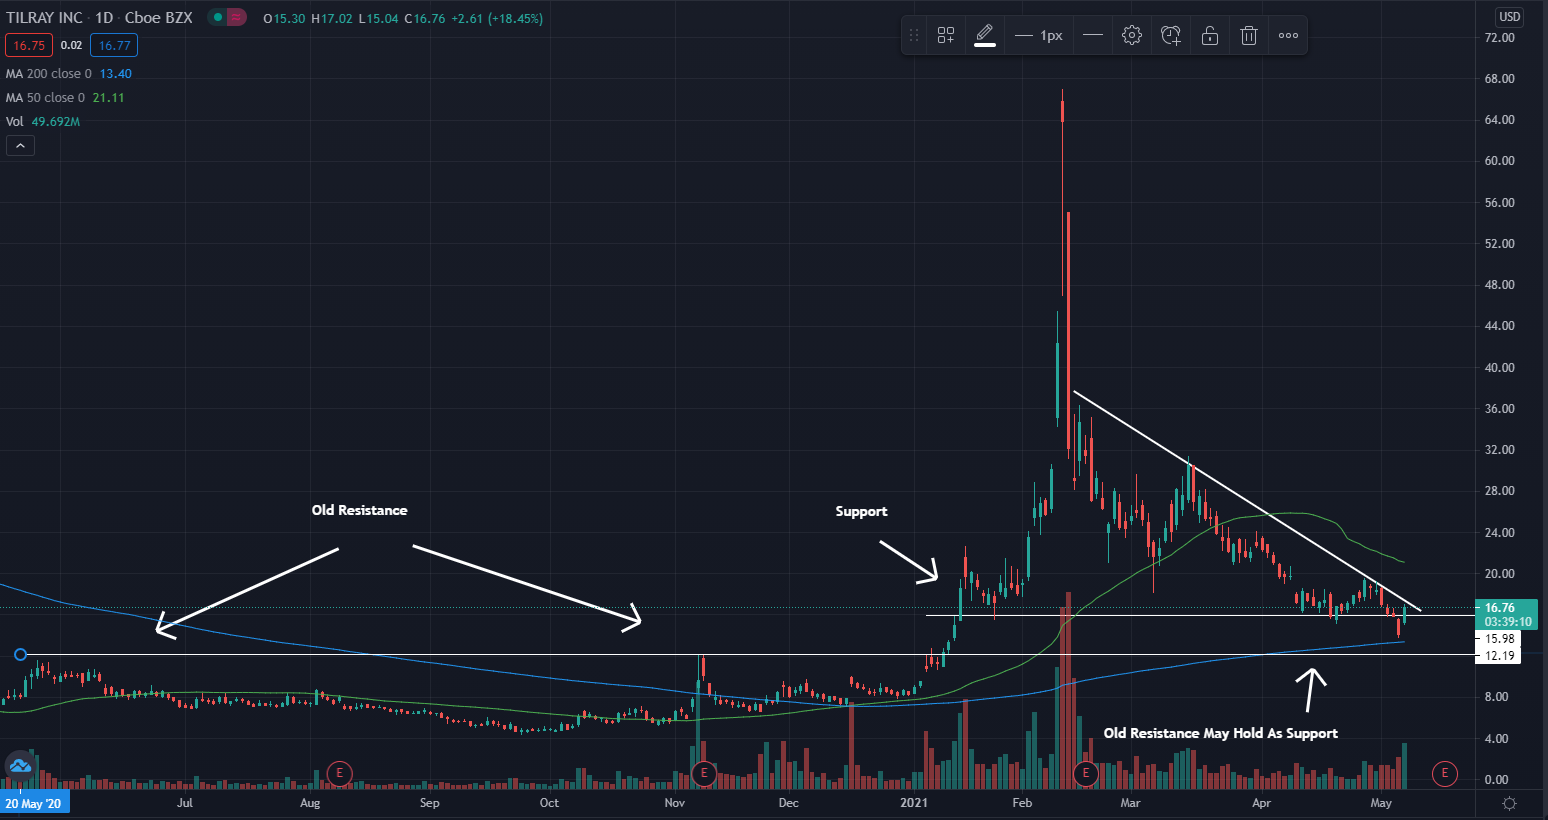
Tilray Daily Chart Analysis
- The stock is getting squeezed between a previous support and a potential resistance line. The stock may see a strong move in the upcoming weeks.
- The stock is trading below the 50-day moving average (green) and above the 200-day moving average (blue), indicating the stock is likely trading in a period of consolidation.
- The 50-day moving average may hold as a place of resistance and the 200-day moving average may be somewhere the stock finds support in the future.
Key Tilray Levels To Watch
- The price of Tilray stock has been getting squeezed between two key levels and could see a move soon.
- The stock has been pulling back and forming lower highs in recent months. The line connecting these highs has continued to hold as resistance.
- The stock has shown to have two key levels in the past that could hold as support in the future. The $12 level is an area where the stock once found resistance, but now may find support.
- The $16 level is another place where the stock has previously found buyers. This area may hold as support in the future.
What’s Next For Tilray Stock?
Bullish technical traders would like to see the stock break above the line connecting the highs. This could mean the stock is about to start an uptrend. Bulls would like to see the stock build higher lows following a break of resistance.
Bearish technical traders would like to see the stock fall below support levels. If the stock were to fall below both support levels and consolidate, it could be prone to a further push down. If the stock breaks below the 200-day moving average, sentiment may turn bearish.
Photo courtesy of Tilray.
Posted In: APHA TLRY